My Keyword is Broken

Exploring alternatives to keyword searching with Stuart Clarke
When I started my career as an investigator, data volumes were tiny relative to what we are used to today. Hard drive storage was seldom more than a handful of gigabytes, and floppy disks were still a common form of storage media. These smaller data volumes meant I could investigate them in detail, but as volumes grew, I became more dependent on new investigative techniques and workflows, which included a time-saving solution: keyword searching. Like many investigators, I would compile a list of relevant keywords, then leverage machine technology to find any instances of these words.
Today, things have changed. Well-crafted keywords can be highly effective, but keyword searching is not my go-to solution for investigative work. Instead, the powerful analytics tools now at our disposal offer a more effective solution for the future.
The problem with keyword searching
If we rely on keywords alone, it is unlikely we will find success or even helpful results. While keywords can help us find known information, they do little to help us find the unknown – which is paramount for counter terror, fraud and cyber analysts who are striving to prevent future incidents.
Common challenges of keyword searching include:
- Target data must be text searchable: it is relatively common for files to be image-based and therefore require a secondary OCR (Optical Character Recognition) process to make them searchable. Even once this process is complete, post-OCR search accuracy can be variable.
- False positives: long lists of keywords will often return a large volume of results, necessitating a time-consuming review, which will often lead to the majority being deemed irrelevant.
- False negatives: poorly considered keywords may return very few hits, but that does not always mean there is no relevant data. There is a high risk of missing key information and making poor decisions as a result.
- Data is rarely in plain English: emojis, acronyms and code words are increasingly used and add to challenge of searching for keywords. Furthermore, results may exist in other languages – which won’t be found if only a keyword in English is used.
- Overly broad keywords: searches for acronyms or widely used terms like privacy (almost every website has a privacy policy) will return large volumes of irrelevant data, making it almost impossible to identify what you are searching for.
Fortunately, there is a better way. Modern technologies and analytics are an increasingly powerful part of our investigative toolbox, providing better results and reducing our dependence on keywords.
Seeking an alternative
Even with the best keywords in the world, we cannot escape the challenge of identifying meaningful information from a large and disparate data set. To overcome this, we need a logical way to slice and dice a dataset, and visualisation solutions are perfect for this.
Timelines
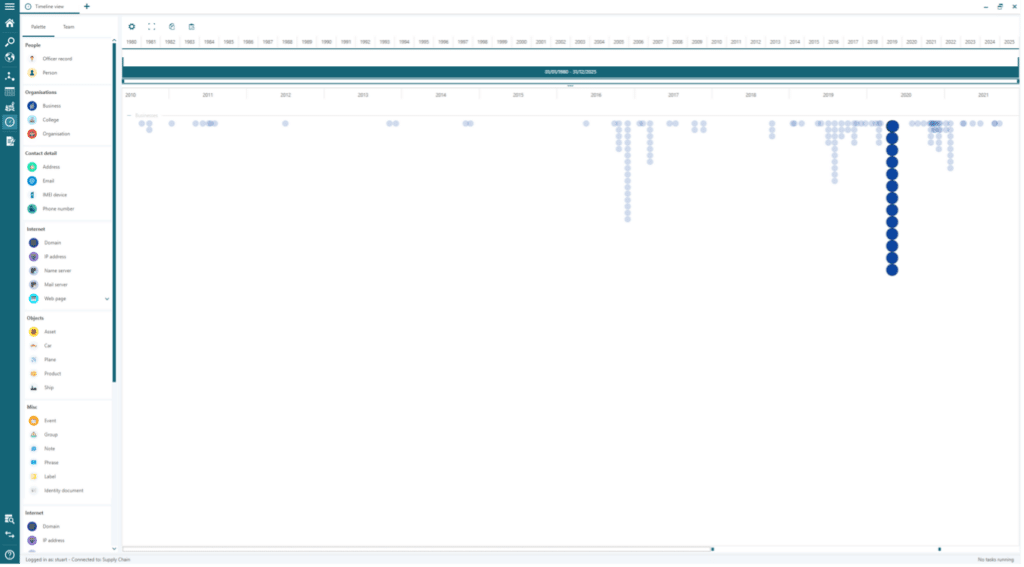
One common visualisation technique is to plot the data on a timeline. In the below example, hundreds of company records associated with a single individual can be plotted on a timeline to reveal a spike in activity. Closer inspection of this outlier reveals that a series of businesses were wound up on the same day, which may indicate fraudulent activity. We have gained significant insights without the use of keywords.
Maps
Map visualisations offer the same quick, and powerful insights in terms of clusters of activity or outliers. They also help investigators to overcome the challenges of multi-jurisdictional or multi-language investigations: if an investigator relied on keyword searching to find activity in a particular region – such as the UK – they will miss activity outside of the region. A good example is analysing all tweets from a specific location: tweets outside of that location that might share similar content or hashtags and therefore prove relevant can easily be missed. Instead of using keywords, plotting the tweets on a map can allow us to quickly identify clusters of shared hashtags, similar text content or accounts retweeting the content in various parts of the world. This provides us with more complete information which we would not be able to access through keyword searching.
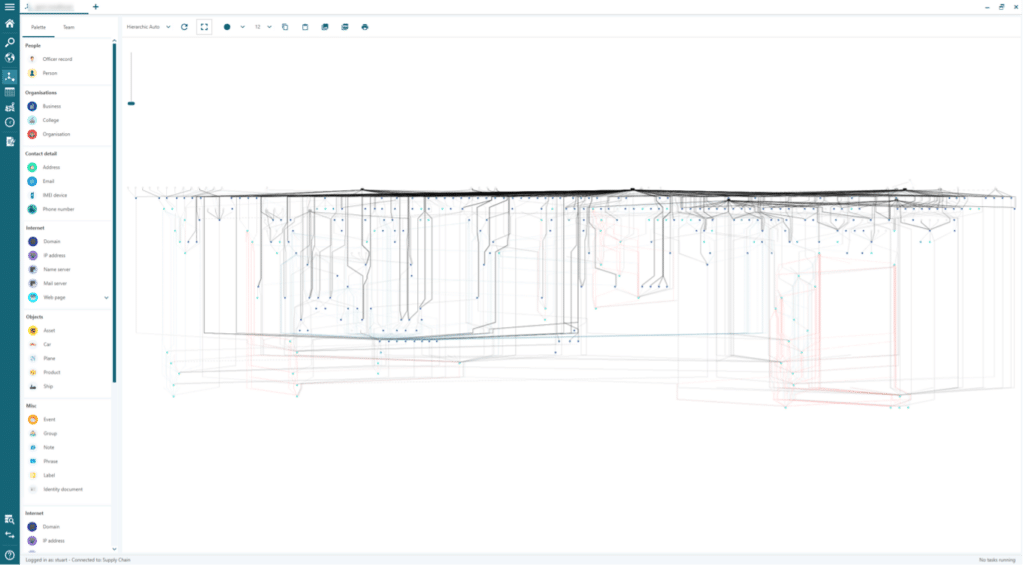
The visualisation of entities and relationships helps investigators understand the connectedness of a data set, which in todays networked world has never been more important. Technologies like NLP continue to improve, meaning we can easily extract entities like person names, companies, addresses, email addresses and more. Not only is entity extraction powerful, but it helps investigators find hidden relationships and understand the broader context of the findings with little effort. Take the example below where we have a sizeable data set with hundreds of relationships. While this visualisation looks busy, we can immediately see that there are three entities at the top of the chart which connect all of the remaining information.
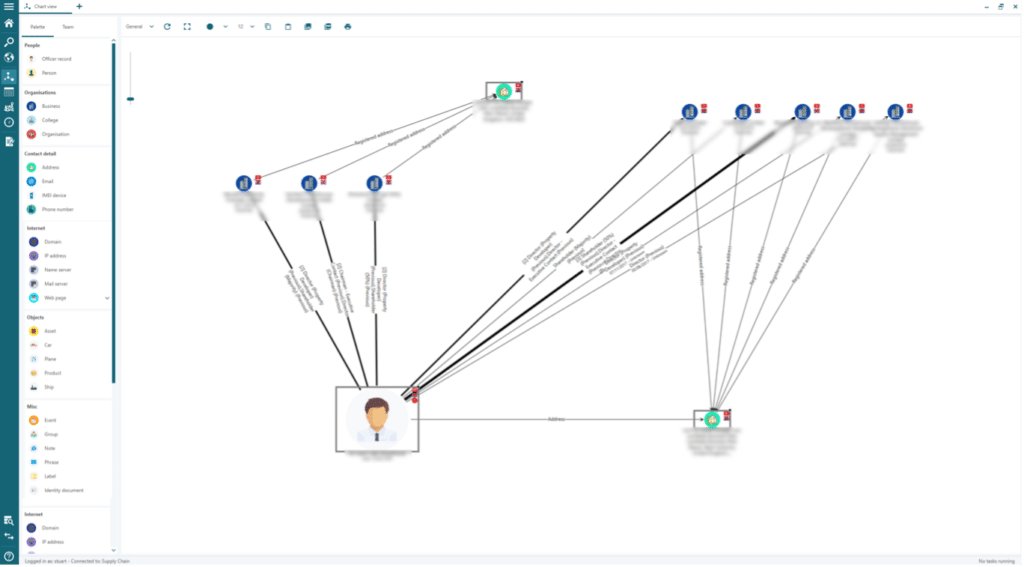
On a more granular level we can use visualisations to determine how different data might be connected. In this next example we can see 2 address entities (green icons), which are connected by a person (larger person icon) who is an officer of companies at each address. Keyword searches do not provide this narrative.
Thematic and cluster visualisations
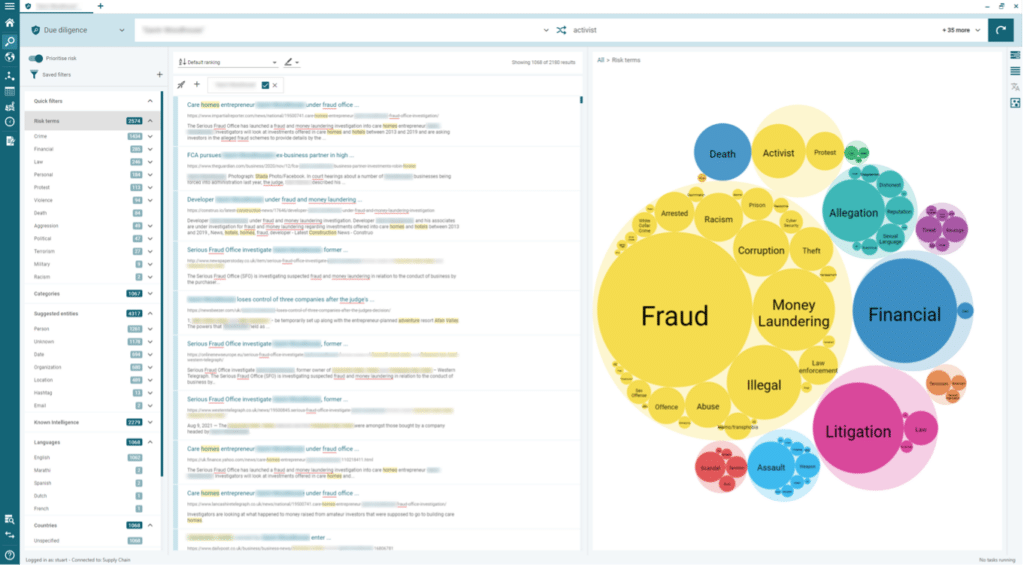
An area which I feel provides investigators with a significant advantage is the use of machine learning, which, when applied correctly, can automatically cluster similar data and extract topics from the text content. Whereas keyword searching finds keywords in the text, topic modelling will infer topics from the text by looking for specific patterns relative to a particular topic – for example, whether the text discusses theft of funds or something more innocent like the work summer BBQ. Clustering can either be used to create topic-based clusters, or less specific groupings. Its power should not be underestimated because clusters are better-equipped to present general trends in content than keyword searches are. For example, a keyword hit for “offshore” might find the word “offshore”, but the context or topic might be innocent and relate to an offshore wind farm rather than offshore tax havens. This might not be reflected in individual results, but will be clearer if we look at clustered themes. In the example below we can see a series of results in response to a search, but on the right, we see visual clusters across all the data, which allows investigators to interactively filter on the clusters and understand the bigger picture.
The limitations of keywords
It’s clear that while keywords serve a purpose, there are challenges and limitations in terms of how and when they are applied and the value they deliver. Keyword effectiveness also largely depends on the skill and experience of the investigator, and can be difficult to scale to meet growing demands. The availability of powerful analytics technologies provides credible alternatives which can reveal not only the insights we were looking for, but also those we never knew existed.
Videris, our OSINT investigations solution, helps investigators to collect, analyse and visualise the data they’re searching for, revealing more insights, more quickly. To find out how Videris can transform your organisation’s ability to identify risk, get in touch.

Other articles you maybe interested in

The missing piece of the puzzle? OSINT in public sector counter-fraud strategy
OSINT is essential to the success of public sector counter-fraud strategy. Find out how it can support proactive fraud investigations here..

This Year in OSINT
What are the key trends for OSINT in 2025? Here's a summary of the discussion at January's Year in OSINT event.