Four Investigative Challenges Videris Charts Can Solve

How the right charting tools can increase investigation effectiveness
When carrying out complex investigations, investigators can uncover a lot of data. This becomes a bigger problem when you have very little known intelligence to provide context and have a vast array of different data sources to explore (such as those provided by Videris). When combined, these factors can quickly lead to some common problems:
- Decreasing noise: Huge amounts of data in your view can make it hard to make sense of what’s there.
- Multiple connected datapoints: The same real-world entity can be represented different ways in different data sets.
- Duplication: Discovering that an entity has duplicates within some data sources causes confusion.
- Investigation management: Multiple subjects of interest can mean it’s easy to lose track of which avenues of investigation have been pursued.
In version 4.1 of Videris, we’ve made major improvements to the Chart to help solve these very important problems. These include the ability to group entities and significant changes to auto- layouts.
Let’s see how these improvements help with problems listed above.
Decreasing noise
The challenge
Investigations often begin by casting the net very wide, capturing vast amounts of data in an attempt to spot relationships or key patterns. One example of this is finding the ultimate beneficial owner (UBO) of a company. To do this, investigators are likely to start by finding all shareholders for the company, which may be a mixture of individuals and other companies. This means they then need to explore the shareholders of those companies, and so on… At each stage, they may uncover information which might be important later on in the investigation, but for now, unless those entities are the UBO, they are just clutter.
Decreasing noise with Videris Charts
Instead of deleting these additional companies and individuals from view, the investigator can now add any ‘extra’ data to groups. This allows you to collapse hundreds of entities down to just a handful of “shareholder” groups, creating vital space on your investigation canvas. At any time, the groups can be expanded again to reveal the contents. If you uncover a new relationship to an entity in one of the groups, this can be seen immediately and may be a turning point in your investigation.
Multiple connected datapoints
The challenge
Nowadays, almost any person is represented in many different ways in the digital world. For example, I have social media profiles on Facebook, Twitter and Instagram, as well as a developer profile on GitHub and a professional profile on LinkedIn. It is possible that I am listed in some corporate registries as an officer. I am a customer on many online stores, some of which may have leaked my data. In an investigative context, you’d need several entities to represent just me and my various online profiles.
Consolidating findings with Videris
All of the data connected to an individual can take up a lot of space on a visualisation, which can be confusing. To simplify analysis, it’s now possible to add all of this data to a single group representing a subject of investigation. This avoids the need to merge all these entities together, potentially losing vital details in the process. All the relationships to companies, posts/tweets, locations, other real/digital entities are preserved and remain visible.
At the same time, Videris ensures that differences between data are always highlighted using visual pointers to represent data types. Investigators can even create nested groups so that multiple real-world entities are grouped together, having already grouped each of their digital representations.
Duplication
The challenge
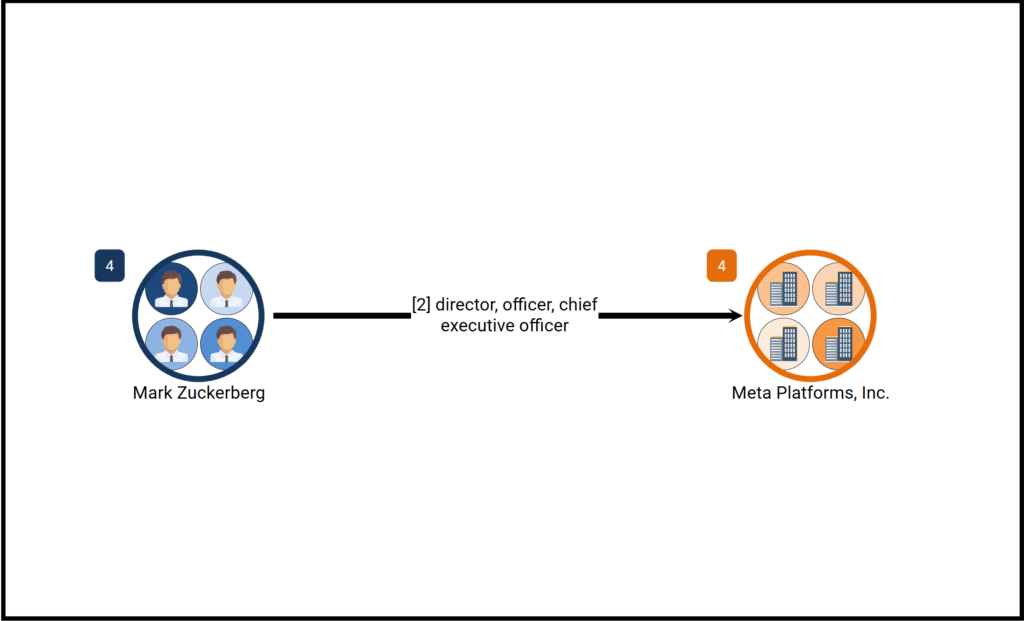
Similarly to the above, investigators often find that the same entities exist in different (or even sometimes the same) data source under different IDs. This is a particularly common problem when dealing with corporate records. Take Mark Zuckerberg for example: all four of these director profiles belong to him:
- MARK ZUCKERBERG (607493724)
- MARK ZUCKERBERG (583288701)
- MARK ZUCKERBERG (251019538)
- MARK ZUCKERBERG (117230142)
…and there are more! That’s before even looking at other data sources.
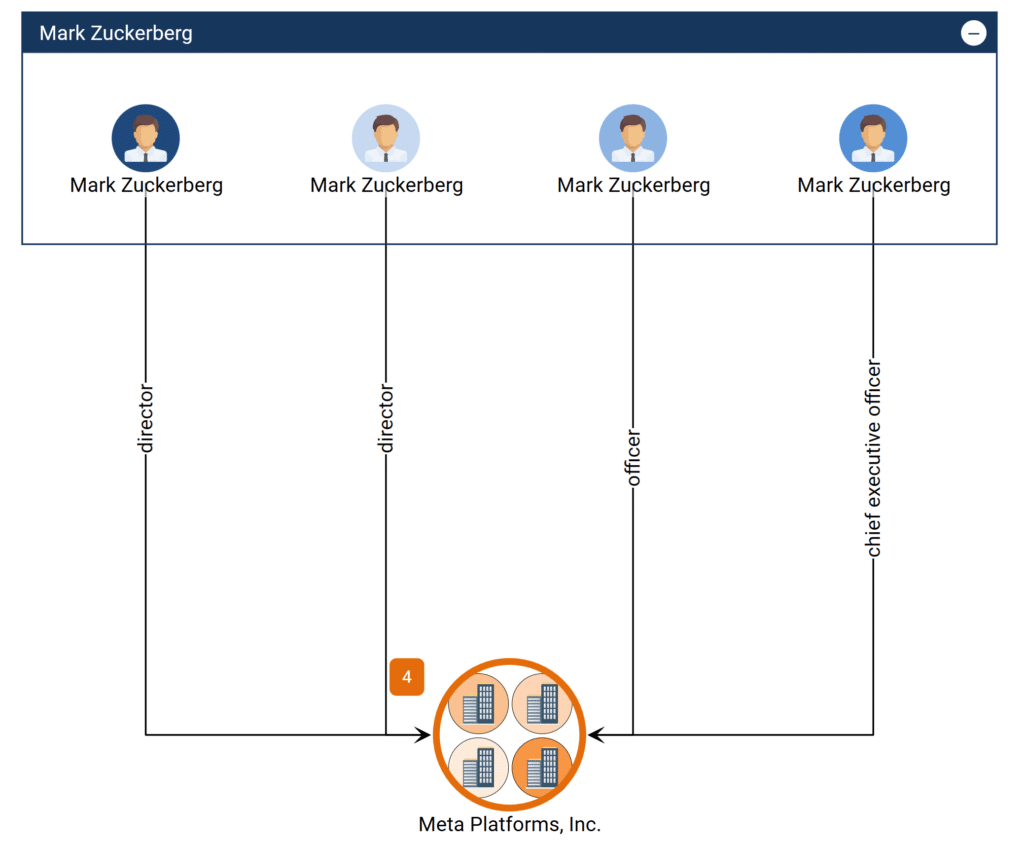
Each entity shows different relationships to Meta Platforms, Inc and fellow officers (and the various IDs for these entities). An investigator wishing to conduct a thorough investigation into Mark Zuckerberg, would probably want to include them all, so as to leave no stone unturned.
However, this can again lead to a very dense and cluttered chart. Merging all the Mark Zuckerbergs may cause the investigator to become confused about the source of this data, making it difficult to use this data as evidence later.
Avoiding sourcing issues with Videris
With Videris, the investigator can use groups to collapse all these entities into a single node and it will automatically be named “Mark Zuckerberg”. This allows them to keep all of the data – and its sourcing – without the added confusion of displaying all of them on the chart.
Investigation management
The challenge
Once the investigator has built out networks and decluttered their chart, they need to explore whether entities uncovered are relevant to the investigation. How do they keep track? And how do they explain to stakeholders what they have done?
Organising your investigation with Videris
With Videris grouping, it’s simple to sort entities into “Done” and “To-do” groups. Drag & drop makes it easy to transition entities between the two groups. Alternatively, investigators can make use of tags and the improvements to Videris’s auto-layouts, or use the entirely new Organic (clustered) layout.
These layouts now place entities with common tags in close proximity. The new Organic (clustered) layout takes this a step further by clustering entities with the same tag together. In the absence of tags, the layouts place entities based on data type. Investigators can achieve a clear, well-laid-out chart in a few clicks, leaving them with more time to focus on analysis.
With a well laid-out chart, investigators can explain their findings to stakeholders far more easily and clearly, reducing the time they need to spend report-writing.
Conclusion
The new Videris grouping and auto-layout features are transformative for investigators who are working with large volumes of data in the chart. Investigators can now confidently cast your investigative net as wide as they need to, knowing that your charts can be used to keep track of all your data and your investigation’s progress, whilst remaining presentable and ready to attach to reports.
To learn more about these features, or to see them in action in Videris, get in touch.
Other articles you maybe interested in

The missing piece of the puzzle? OSINT in public sector counter-fraud strategy
OSINT is essential to the success of public sector counter-fraud strategy. Find out how it can support proactive fraud investigations here..

This Year in OSINT
What are the key trends for OSINT in 2025? Here's a summary of the discussion at January's Year in OSINT event.